

Prometheus và Grafana có thể nói là đôi bạn cùng tiến trong mảng monitoring. Trong DevOps, thì việc monitoring để giám sát hệ thống là vấn đề cần quan tâm.
Bài viết này sẽ chia sẻ vài điểm cơ bản về Prometheus và Grafana và cách setup để monitoring một hệ thống Jenkins trên Kubernetes
Prometheus and Grafana
Prometheus là một tool open source phục vụ cho việc monitoring và alerting. Ban đầu được phát triển bới SoundCloud sau này được open source và được cộng đồng phát triển
Nếu như Prometheus là tool dùng để collect metrics thì Grafana là tool để visualize những data đó lên dưới dạng biểu đồ. Nó giúp dữ liệu được hiển thị một cách trực quan
Ví dụ về màn hình hiển thị của grafana

Chi tiết lý thuyết về Prometheus và Grafana có rất nhiều trên GG, cho nên bài viết này sẽ đi sâu vào phần thực hành
Setup Prometheus and Grafana
Cài đặt và cấu hình Prometheus và Grafana để monitoring 1 Jenkins cluster
Ở phần thực hành này, Prometheus và Grafana được cài đặt 1 cluster K8s. Prometheus sẽ monitor trạng thái của Jenkins cluster như node status, namespace, memory usage …
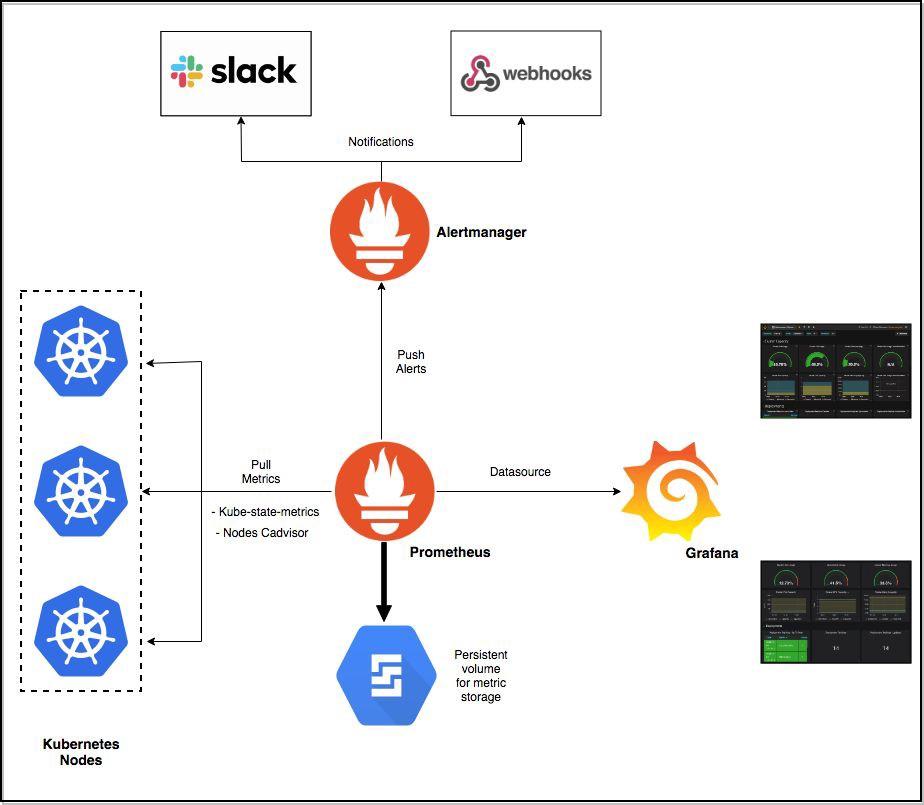
Dữ liệu collect bởi Prometheus được visualize trên Grafana. Trong trường hợp hệ thống gặp issue, sẽ alert sẽ được push tới Altermanager và notify tới user qua các kênh như Slack hoặc Webhook
Giả sử Jenkins (Master + slaves) đã được cài đặt trên một cluster K8s. Bạn có thể dùng chính cluster này để cài đặt Prometheus và Grafana
Thực tế dự án sẽ không cài đặt bằng manual mà dùng Infra as Code.
Trên K8S, bạn có thể cài đặt Prometheus bằng yaml file như ở dưới

File quan trọng nhất là *-deployment, định nghĩa các thông số của Prometheus bao gồm image, port, volume

Sau khi kết nối với cluster, bạn tiến hành deploy Prometheus lên k8s bằng lệnh
kubectl apply –f prometheus –n monitoring
Prometheus sẽ được deploy dưới dạng 1 k8s pod và service như ở dưới
Prometheus service
apiVersion: v1
kind: Service
metadata:
annotations:
prometheus.io/scrape: "true"
name: prometheus-service
namespace: monitoring
labels:
name: prometheus
spec:
selector:
app: prometheus-server
ports:
- name: prometheus
port: 8080
targetPort: prometheus
#type: LoadBalancer
Grafana sẽ get metrics từ Prometheus service để display
Làm tương tự với grafana
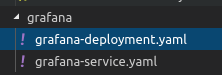
Tương tự như Prometheus, grafana cũng được deploy lên k8s dưới dạng docker container , port 3000

Pod grafana được expose bằng service load balancer
apiVersion: v1
kind: Service
metadata:
labels:
# For use as a Cluster add-on (https://github.com/kubernetes/kubernetes/tree/master/cluster/addons)
# If you are NOT using this as an addon, you should comment out this line.
kubernetes.io/cluster-service: 'true'
kubernetes.io/name: grafana
# cloud.google.com/load-balancer-type: "Internal"
name: grafana
namespace: monitoring
spec:
type: LoadBalancer
loadBalancerSourceRanges:
- 10.10.43.0/23
Bạn có thể giới hạn truy cập bằng các set thuộc tính loadBalancerSourceRanges bằng CIDIR
Để có thể monitor được pod, và node trong Jenkins K8S, bạn có thể sử dụng kube-state-metrics Add-on agent to generate and expose cluster-level metrics. Hiểu nhanh là 1 add-on agent có thể collect metric thông tin về cluster (pod, node…)
Alert Manager cũng được setup tương tự
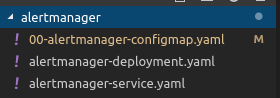
Trong K8S có một khái niệm là config map, được hiểu là các thông tin config dùng chung giữa các pod. Mục đích là tách biệt giữa code và file cấu hình.
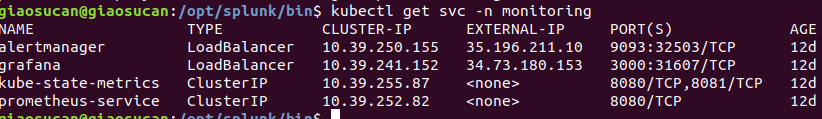
Khi cài đặt xong bạn sẽ thấy các service và pod được install trên k8s
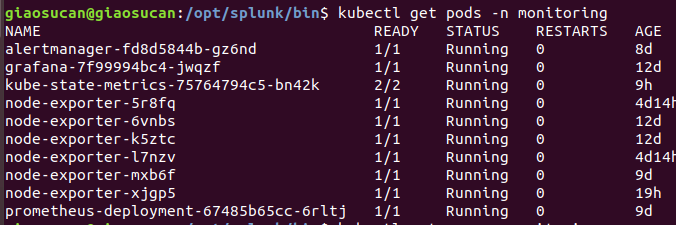
Bây giờ truy cập grafana bằng IP/Port như trên bạn có thể monitoring được trạng thái của Jenkins cluster như memory usage, container status….
Khi hệ thống có trục trặc, các alert sẽ được send bởi alertmanager đến các kênh như mail hay slack
0 Nhận xét